
Volume Profile is a trading analysis tool that shows how trading volume is distributed across different price levels within a selected period or price range.
Unlike a traditional volume indicator, which displays volume along the time axis, Volume Profile organizes volume by price. This allows traders to see where the market previously concentrated its activity and identify important reference levels such as the Point of Control (POC), Value Area High (VAH), Value Area Low (VAL), High Volume Nodes (HVN), and Low Volume Nodes (LVN). For a broader overview of the topic and related concepts, see the Volume Profile guide.
In simple terms:
Traditional Volume asks: “How much volume traded during this candle?”
Volume Profile asks: “At which prices did the market trade the most volume?”
This difference makes Volume Profile particularly useful for understanding the relationship between price, volume, acceptance, and rejection.
What Is Volume Profile?
Volume Profile is a volume-at-price analysis tool that displays the amount of trading activity associated with different price levels.
Instead of placing volume bars underneath the chart according to time, Volume Profile creates a horizontal histogram alongside the price axis.
A simplified representation looks like this:
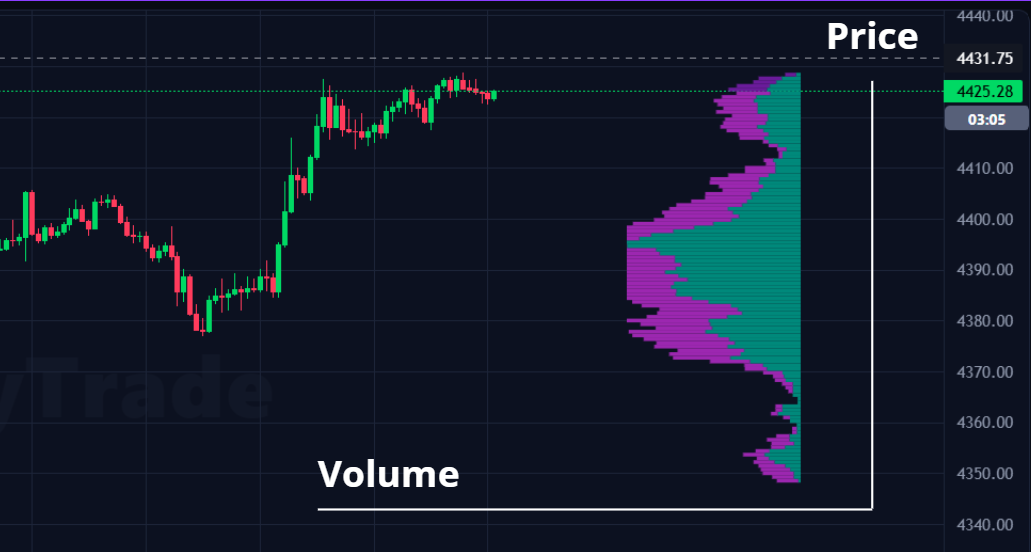
The wider the profile at a particular price, the greater the volume associated with that price level within the selected range.
This gives traders another way to analyze the market:
Price + Volume by Price → Market Structure
Volume Profile is therefore not simply another version of the traditional volume indicator. It provides a different perspective on where trading activity was concentrated.
Volume Profile vs. Traditional Volume
The easiest way to understand Volume Profile is to compare it with standard volume.
Traditional Volume
Traditional volume is organized by time.
For example:
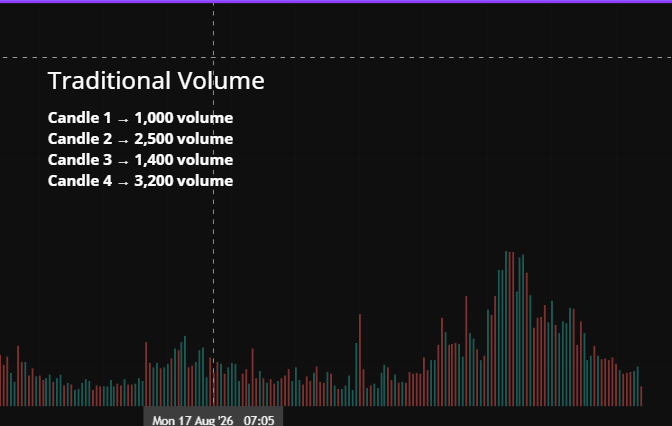
It helps answer:
How much activity occurred during each candle?
Volume Profile
Volume Profile is organized by price.
For example:
It helps answer:
At which prices did the market trade the most?
That distinction is fundamental.
A trader can therefore use traditional volume to study when activity increased and Volume Profile to study where that activity occurred.
How Does Volume Profile Work?
At a high level, a Volume Profile is created by analyzing volume within a selected range and distributing that volume across price levels.
The exact calculation can vary depending on the platform, data source, profile type, and settings.
The general process can be understood as:
Select a price/time range
          ↓
Collect volume data
          ↓
Distribute volume across price levels
          ↓
Build the volume histogram
          ↓
Identify important volume areas
From this distribution, several important levels can be identified:
- POC — Point of Control
- Value Area
- VAH — Value Area High
- VAL — Value Area Low
- HVN — High Volume Node
- LVN — Low Volume Node
These levels provide a framework for interpreting where the market previously showed greater or lower participation.
What Is POC in Volume Profile?
POC (Point of Control) is the price level with the highest traded volume within the selected Volume Profile range.
It can be visualized as the widest point of the profile
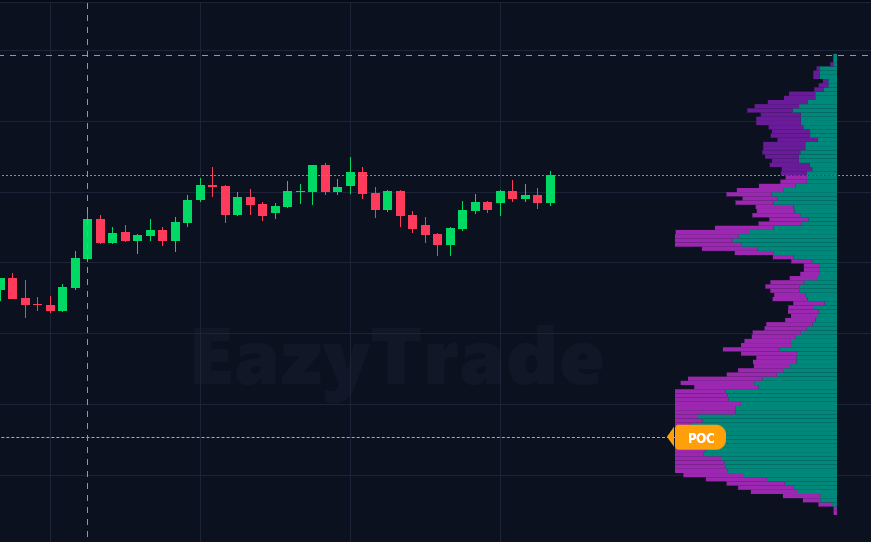
Because POC represents the price level with the highest volume concentration in the selected range, traders often use it as an important reference when analyzing current price location.
However, POC is not automatically a buy or sell signal.
Its meaning depends on the broader market context and how price behaves around the level.
→ Related guide: What Is POC in Volume Profile?
What Is the Value Area?
The Value Area (VA) is the range of prices containing a specified percentage of the total volume within the selected profile.
A commonly used setting is 70%, although the percentage can be changed according to the trader's methodology and platform settings.
The Value Area has two boundaries:
- VAH — Value Area High
- VAL — Value Area Low
Conceptually:
       VAH
        │
   ┌───────────┐
   │           │
   │ Value     │
   │ Area      │
   │           │
   └───────────┘
        │
       VAL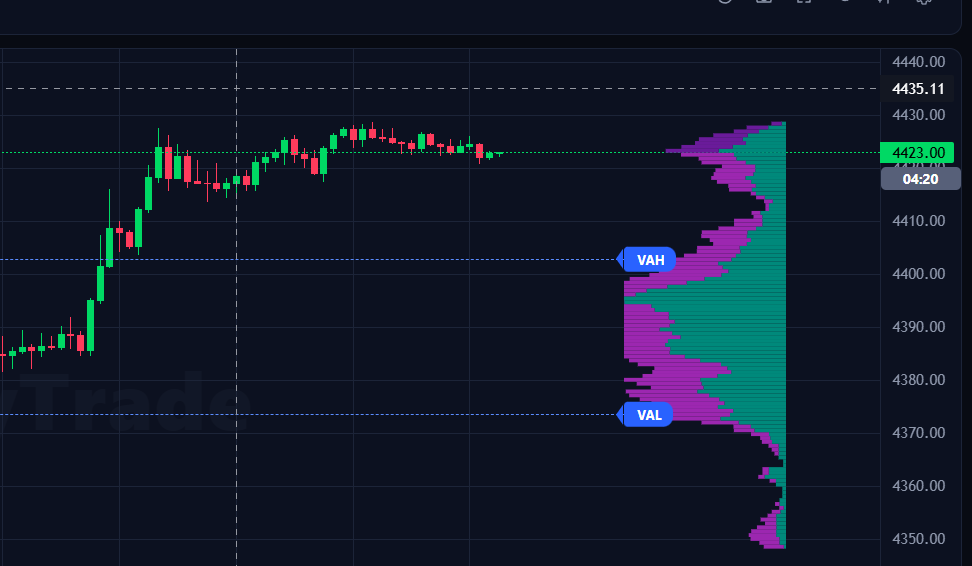
The Value Area provides a way to identify the central range where a significant portion of the profile's volume was traded.
What Is VAH?
VAH (Value Area High) is the highest price level included within the Value Area.
In a Volume Profile:
       VAH ← Upper boundary
        │
        │
      Value
      Area
        │
        │
       VAL ← Lower boundary
VAH can be useful as a reference when analyzing how price behaves near the upper edge of the Value Area.
For example, traders may observe whether price:
- rejects the area,
- consolidates around it,
- moves above it and remains there,
- or returns back into the Value Area.
The important point is that VAH describes a structural level from historical volume distribution; it does not guarantee what price will do next.
What Is VAL?
VAL (Value Area Low) is the lowest price level included within the Value Area.
Like VAH, VAL can be used as a reference point when studying price behavior.
Traders may observe whether price:
- rejects lower prices,
- consolidates around VAL,
- breaks below the Value Area,
- or returns inside the Value Area.
VAH and VAL become much more meaningful when combined with price action and broader market context, rather than being treated as standalone signals.
What Are HVN and LVN?
Another important part of Volume Profile is the identification of High Volume Nodes (HVN) and Low Volume Nodes (LVN).
HVN — High Volume Node
An HVN is an area where volume is relatively high compared with surrounding price levels.
HVNs often represent areas where substantial trading activity took place and where the market showed stronger participation.
A simplified profile might look like:
LVN — Low Volume Node
An LVN is an area where volume is relatively low compared with nearby price levels.
LVNs can represent thinner areas of the volume distribution, where the market previously traded less volume.
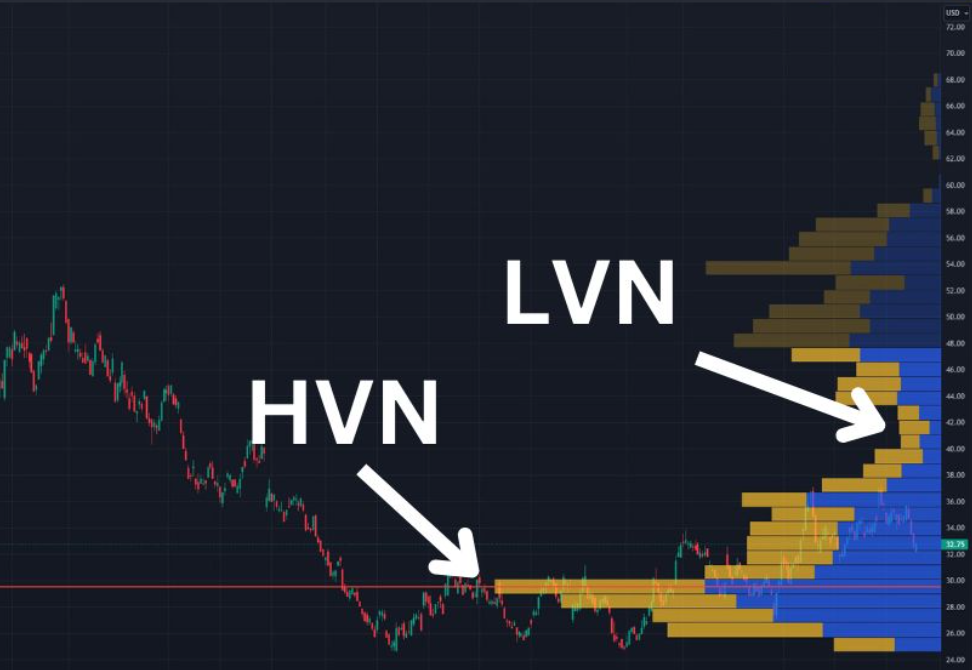
The contrast between HVN and LVN helps traders understand the shape of the volume distribution rather than focusing only on one price level.
→ Related guide: HVN vs. LVN: What Is the Difference?
How to Read a Volume Profile
For beginners, a simple workflow can make Volume Profile much easier to understand.
Step 1: Define the Profile Range
First, understand what part of the market the profile represents.
The selected range matters because the resulting POC, Value Area, HVN and LVN depend on the data included in the profile.
Step 2: Locate the POC
Find the price level where the profile is widest.
This is the POC — the price level with the highest traded volume within the selected range.
Step 3: Identify VAH and VAL
Next, identify the upper and lower boundaries of the Value Area.
This gives you a reference for where the selected percentage of the profile's volume was concentrated.
Step 4: Examine HVN and LVN
Look beyond the POC.
The shape of the entire profile can reveal areas of relatively high and low volume concentration.
This is often more informative than looking at a single level in isolation.
Step 5: Watch How Price Behaves
This is where Volume Profile becomes a market-analysis framework, rather than simply a collection of horizontal lines.
Ask:
- Is price inside or outside the Value Area?
- Is price approaching POC?
- Is price reacting around VAH or VAL?
- Is price moving through an LVN?
- Is price slowing down around an HVN?
- Is price accepting or rejecting a particular area?
The answers should be combined with price action, market structure, and risk management.
What Does Volume Profile Tell Traders?
Volume Profile primarily helps traders understand historical participation by price.
It can provide context for several important market behaviors.
Market Acceptance
When significant volume has accumulated around an area, it can indicate that the market previously conducted substantial trading activity there.
Market Rejection
Areas with relatively low volume may indicate that the market spent less time trading at those prices.
Balance
A concentrated profile can help traders identify areas where the market previously established a degree of balance.
Imbalance
A thinner portion of the profile can help traders identify areas where participation was relatively limited.
These observations are useful because they help answer a broader question:
Where did the market accept price, and where did it move through price relatively quickly?
But Volume Profile remains a reactive analytical tool: it describes what happened within the selected data rather than guaranteeing what will happen next. TradingView explicitly notes that Volume Profile reflects historical activity rather than predicting future price movements.
How Traders Use Volume Profile
Volume Profile can be incorporated into several types of trading analysis.
1. Identify Important Price Areas
POC, VAH, VAL, HVN and LVN can provide reference points for analyzing the current position of price.
2. Analyze Acceptance and Rejection
Price behavior around volume areas can provide additional context about whether the market is accepting or rejecting certain prices.
3. Study Support and Resistance
Historical volume concentration can help traders identify areas worth monitoring as potential support or resistance.
However, these levels should not be treated as guaranteed support or resistance.
4. Build Trading Setups
Volume Profile can be combined with:
- Price Action
- Market Structure
- Candlestick confirmation
- CVD or volume-flow information
- Risk management
This creates a more complete trading framework than using Volume Profile levels alone.
Volume Profile Trading Strategy
There is no single universal Volume Profile strategy.
A practical approach is to use Volume Profile to answer three questions:
Where is price relative to value?
Above VAH
Inside Value Area
Below VAL
Where is the major volume concentration?
POC
HVN
Where is volume relatively thin?
LVNThen observe how price reacts.
For example:
Volume Profile
      ↓
POC / VAH / VAL / HVN / LVN
      ↓
Current Price Location
      ↓
Price Action Confirmation
      ↓
Entry
      ↓
Invalidation + Risk Management
This is an important distinction:
Volume Profile provides market context. It does not replace a complete trading plan.
Volume Profile Example
Consider an XAUUSD chart where the profile identifies:
- POC
- VAH
- VAL
- HVN
- LVN
Instead of immediately entering a trade when price touches one of these levels, a trader can first ask:
- Where is current price relative to the Value Area?
- Is price approaching or leaving POC?
- Is price reacting around VAH or VAL?
- Is the market accepting the new price area?
- Is there confirmation from Price Action?
- Where would the trading idea become invalid?
This approach turns Volume Profile from a collection of lines into a decision-making framework.
For EazyTrade, this is particularly relevant because the platform is designed around important Volume Profile price zones and combines them with additional chart information such as CVD and candle confirmation.
How EazyTrade Uses Volume Profile
EazyTrade is built around the idea of making Volume Profile-based chart analysis easier to interpret.
The platform highlights important price references such as:
- POC
- VAH
- VAL
- Daily Open Price
- Volume Profile-based support and resistance areas
- Volume CVD
- CVD-based candle coloring
The goal is not to replace the trader's decision-making process with a single signal.
Instead, EazyTrade organizes important information on the chart so traders can focus on where price is, what volume is doing, and how price reacts around important levels.
This creates a workflow such as:
Market Context
      ↓
Volume Profile
      ↓
Important Price Zone
      ↓
CVD / Volume Confirmation
      ↓
Price Action Confirmation
      ↓
Trading Decision
Explore EazyTrade →
Volume Profile vs. Other Trading Tools
Volume Profile is most useful when traders understand what it does — and what it does not do.
| Tool | Main question |
|---|---|
| Traditional Volume | How much volume traded over time? |
| Volume Profile | At which prices was volume concentrated? |
| Price Action | How is price behaving? |
| VWAP | Where is the volume-weighted average price? |
| Market Structure | What is the current structural condition? |
| CVD | How is cumulative buying/selling pressure changing? |
Rather than asking which indicator is "best", a better question is:
What information does each tool add to the decision-making process?
Common mistakes when using Volume Profile
Mistake 1: Treating POC as an automatic entry
POC is a reference level, not a guaranteed reversal point.
Mistake 2: Assuming VAH is always resistance
Price can reject VAH, but it can also accept prices above VAH.
Mistake 3: Assuming VAL is always support
The same principle applies below VAL.
Mistake 4: Ignoring the profile range
Changing the selected range can change the resulting profile and its important levels.
Mistake 5: Using Volume Profile without price confirmation
A volume level alone does not explain the entire market context.
Mistake 6: Using too many indicators
Adding more indicators does not necessarily create a better trading decision.
The objective should be to create a clear decision framework, not a chart filled with signals.
Frequently Asked Questions
What is Volume Profile in trading?
Volume Profile is a chart analysis tool that displays how trading volume is distributed across different price levels within a selected range.
Is Volume Profile better than traditional volume?
Neither is universally better. Traditional volume shows activity over time, while Volume Profile shows where activity occurred across price levels.
What is POC in Volume Profile?
POC, or Point of Control, is the price level with the highest traded volume within the selected profile range.
What are VAH and VAL?
VAH is the upper boundary of the Value Area, while VAL is the lower boundary. The Value Area contains a selected percentage of the profile's volume, commonly 70%.
What are HVN and LVN?
HVN stands for High Volume Node and identifies areas of relatively high volume concentration. LVN stands for Low Volume Node and identifies areas of relatively low volume concentration.
Can Volume Profile be used for Forex?
Yes. Volume Profile can be used as a framework for analyzing Forex charts, but traders should understand the nature and limitations of the volume data provided by their broker or platform.
Can Volume Profile be used for XAUUSD?
Yes. Volume Profile can be applied to XAUUSD to study how trading activity is distributed across price levels and to identify important areas for further analysis.
Final Takeaway
Volume Profile gives traders a different way to look at the market.
Instead of asking only:
“Where is price going?”
it first asks:
“Where has the market actually traded and concentrated its activity?”
POC, VAH, VAL, HVN and LVN provide different pieces of that picture.
But these levels should be treated as context and structural references, not automatic trading signals.
The strongest use of Volume Profile comes when it is combined with price action, market structure, volume-flow information, confirmation, and disciplined risk management.
For EazyTrade, Volume Profile is not simply an indicator. It is the foundation for organizing important price information into a clearer chart-analysis workflow.